How to Build a Financial Dashboard for Smarter Business Decisions
Running a business means constantly making choices—about spending, hiring, investments, and growth. But if you’re relying on scattered spreadsheets or delayed reports, you’re making those decisions with a blurred picture of your financial health. A financial dashboard changes that.
By bringing together your most important numbers in one place, a financial dashboard gives you real-time insights and clarity. Whether you’re a small business owner, a finance manager, or a startup founder, the right dashboard empowers you to make decisions that are faster, sharper, and more strategic.
What Is a Financial Dashboard?
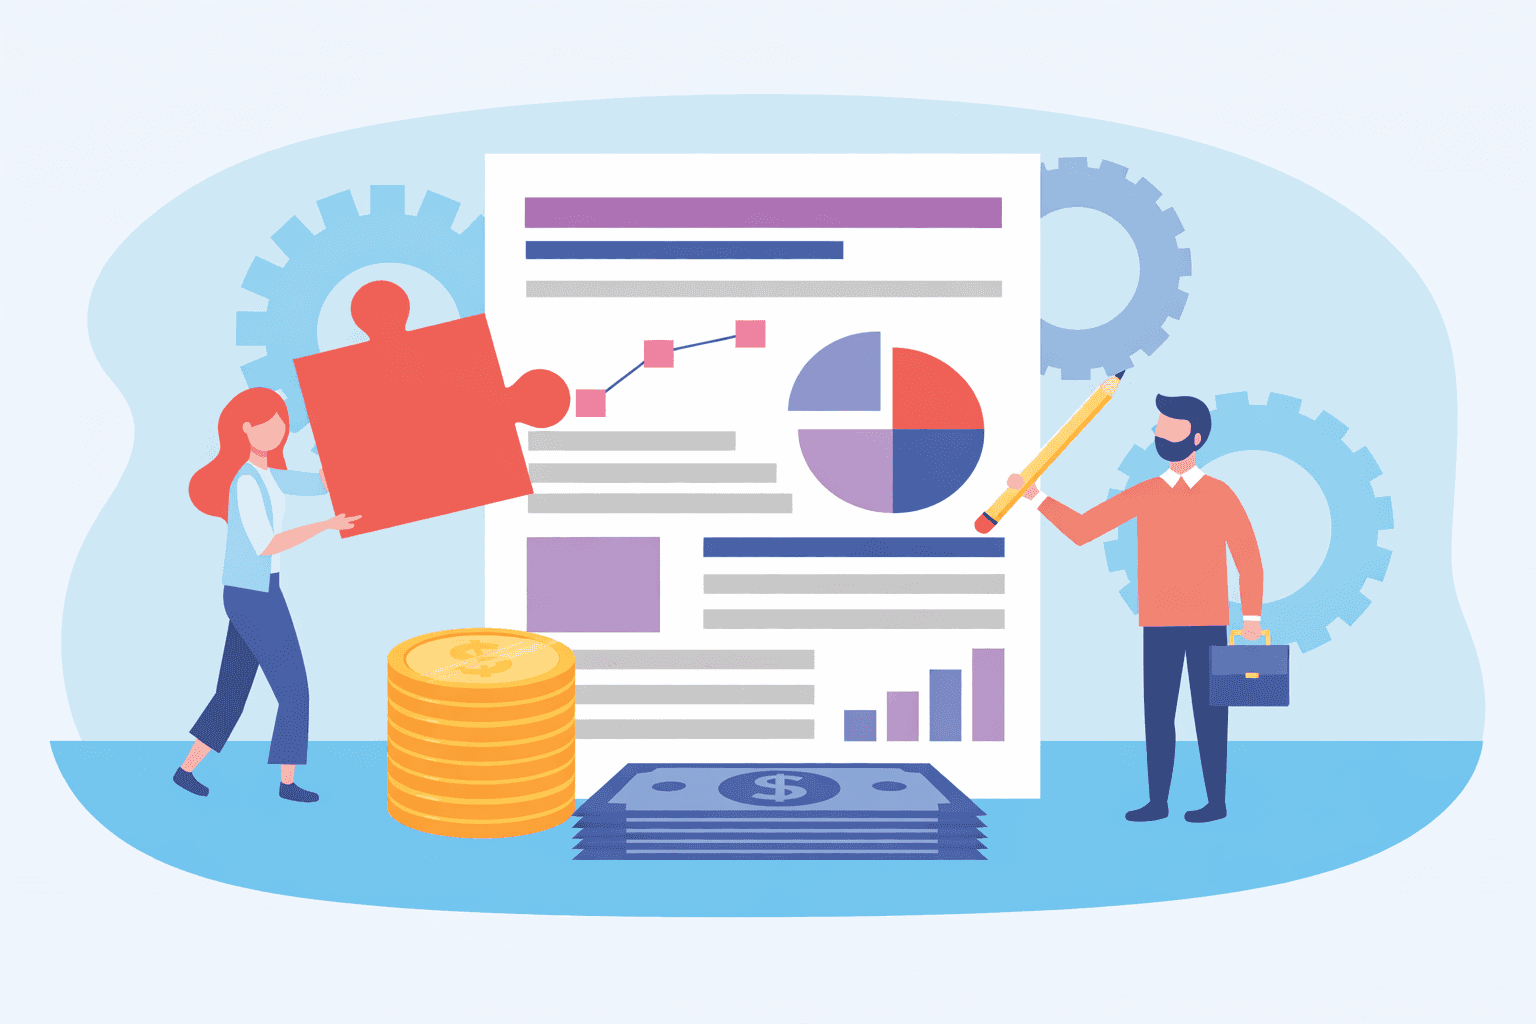
A financial dashboard is a visual reporting tool that consolidates your company’s key financial data. Instead of flipping through profit and loss statements, cash flow reports, and bank statements separately, a dashboard presents all your KPIs in a clear, visual format.
Think of it like your car’s dashboard—it won’t show every nut and bolt, but it will highlight your speed, fuel, and warning lights. In the same way, a financial dashboard spotlights your business’s health so you can act quickly and confidently.
Why Businesses Need Financial Dashboards
1. Faster, Smarter Decisions
Having financial data at your fingertips helps you decide whether to expand, cut costs, or adjust strategy without waiting for month-end reports.
2. Real-Time Cash Flow Management
By monitoring cash inflows and outflows daily, you can prepare for shortfalls, avoid late payments, and allocate funds more effectively.
3. Time Savings
Dashboards automate reporting, saving countless hours of manual consolidation. That time can be reinvested in strategy and operations.
4. Fewer Errors
Manual reporting leaves room for mistakes. Dashboards pull data directly from systems like QuickBooks, Xero, or your bank feeds, reducing risk.
Key Metrics to Include
Every dashboard should highlight the numbers that matter most. Common financial KPIs include:
Cash Flow Position – Tracks liquidity in real time.
Revenue Growth – Compares sales trends month-over-month or year-over-year.
Accounts Receivable – Shows unpaid invoices and overdue balances.
Accounts Payable – Keeps track of bills you need to pay.
Expense Categories – Breaks down where money is going.
Profit Margins – Monitors both gross and net profitability.
Forecast vs. Actual – Highlights differences between projections and reality.
For startups, metrics like burn rate and runway are critical to monitor sustainability.
Steps to Build a Financial Dashboard
1. Define Your Goals
Ask yourself: What decisions do I need this dashboard to support? Clear goals keep your dashboard focused instead of overloaded with data.
2. Choose the Right Tools
Options range from spreadsheets like Google Sheets with add-ons, to business intelligence platforms like Power BI and Tableau, to built-in dashboards within accounting software such as QuickBooks or Xero.
3. Integrate Data Sources
Connect your accounting system, bank accounts, payroll, and sales platforms. Integration ensures data is always accurate and up to date.
4. Design with Clarity
Put the most important KPIs at the top.
Use visuals—charts, trend lines, and color coding—for quick insights.
Keep it clean and uncluttered.
5. Review & Adapt
Dashboards aren’t static. Revisit metrics regularly to make sure they still align with your business priorities.
Real-World Example
Consider a growing e-commerce company. Without a dashboard, the owner waits weeks for financial reports, often too late to address cash flow dips or inventory issues.
With a dashboard:
Sales revenue updates daily.
Marketing spend is compared directly against returns.
Unpaid invoices are flagged before cash shortages hit.
Cash flow forecasts show if funds are available for new hires.
The owner goes from being reactive to proactive—confidently making decisions backed by live data.
Best Practices
Focus on relevance, not volume: A handful of meaningful metrics beats a clutter of numbers.
Automate updates: The less manual input, the more reliable your dashboard.
Tailor to your audience: Executives may want high-level KPIs, while finance teams may need more detail.
Validate accuracy: Always cross-check new dashboards with your accounting data before relying on them.
The Strategic Advantage
Financial dashboards don’t just keep you organized—they position your business for growth. They help in:
Investor presentations – A clear dashboard builds trust and transparency.
Team alignment – When everyone sees the same numbers, strategy becomes unified.
Scenario planning – You can simulate best-case and worst-case outcomes, preparing for uncertainty.
Final Thoughts
A financial dashboard is more than a reporting tool—it’s a decision-making engine. By tracking the right metrics, integrating your systems, and keeping the design simple, you transform financial management from a backward-looking exercise into a forward-looking strategy.
In today’s fast-changing business world, smarter decisions depend on smarter visibility. A financial dashboard gives you that edge—helping you not just manage your business, but steer it toward lasting success.
Share blog:


